Data visualization for the Web
How to display data in a fancy way
Created by Mattia Natali
Why is it important?
Use case: superhero choice
Superhero, Strenght, Defense, Speed, Intelligence, Wisdom, Luck
Mattia, 2, 3, 2, 2, 1, 5
Spiderman, 7, 8, 6, 9, 6, 8
Flash, 9, 8, 10, 7, 8, 6
Batman, 10, 8, 6, 7, 5, 7
| Superhero | Strenght | Defense | Speed | Intelligence | Wisdom | Luck |
|---|---|---|---|---|---|---|
| Mattia | 2/10 | 3/10 | 2/10 | 2/10 | 1/10 | 5/10 |
| Spiderman | 7/10 | 8/10 | 6/10 | 9/10 | 6/10 | 8/10 |
| Flash | 9/10 | 8/10 | 10/10 | 7/10 | 8/10 | 6/10 |
| Batman | 10/10 | 8/10 | 6/10 | 7/10 | 5/10 | 7/10 |
don't like raw numbers
Visual data representation is
- more catchy
- quicker to read
- more intuitive
Choose wisely how to show your data
- some fit in a plot (chart, pie, radar, scatter plot)
- some can be changed with icons ( )
- some with custom views
- ...others keep them unchanged
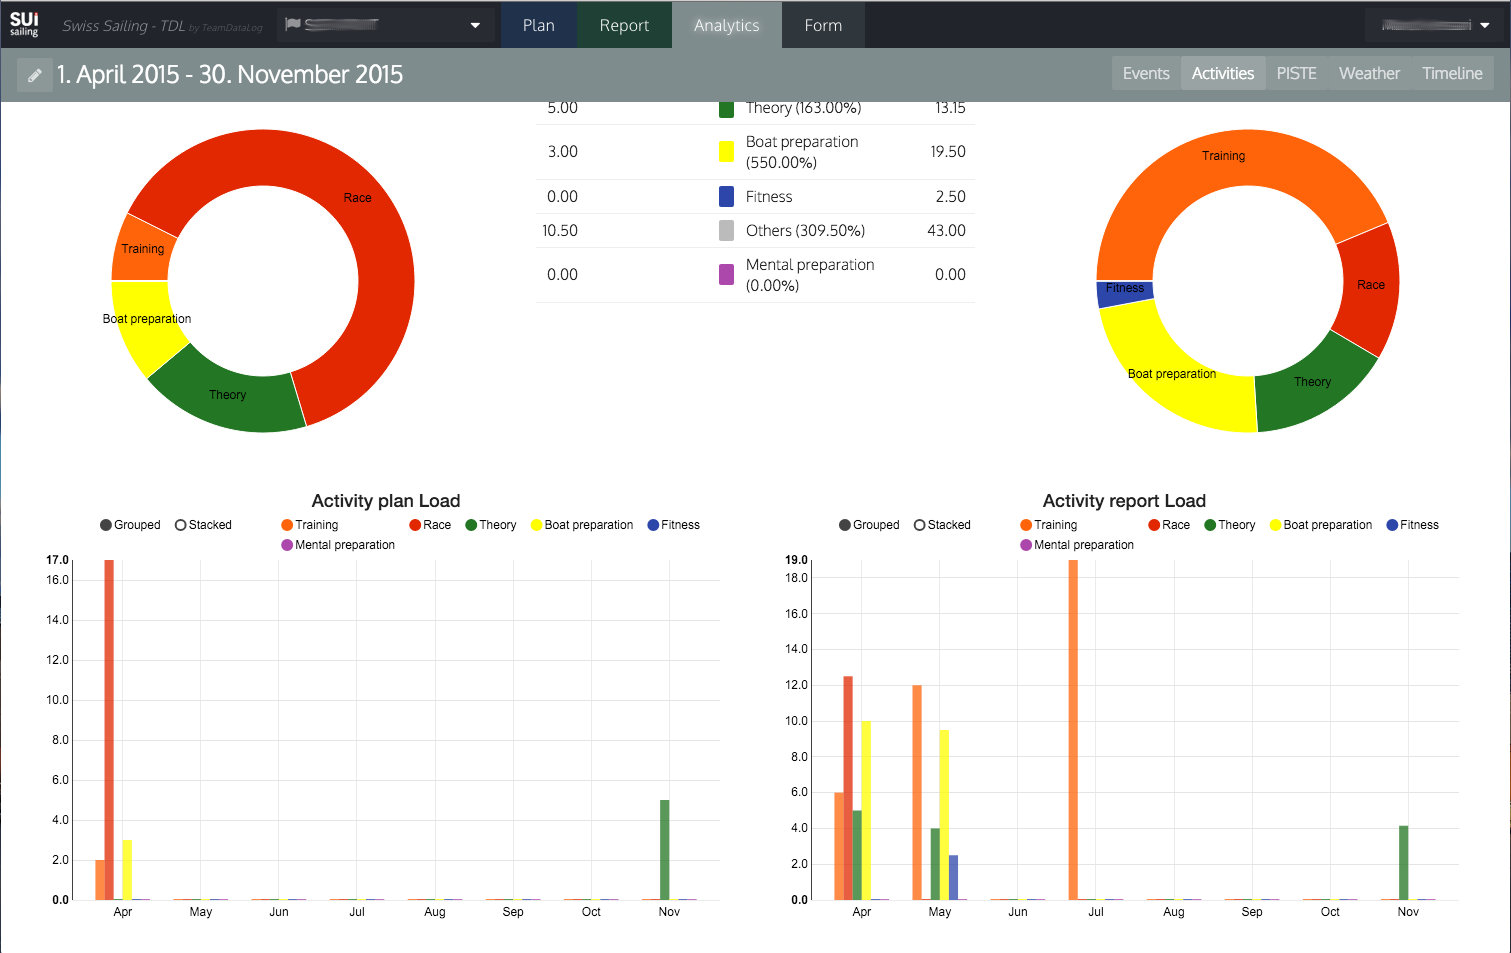
Charts
When to use
- Big amount of data
- We are going to add a table
- We want to compare and analyze data
Chart types
I'm using chart.js
Line chart
Bar chart
Radar
Pie
Pie Advanced
Polar
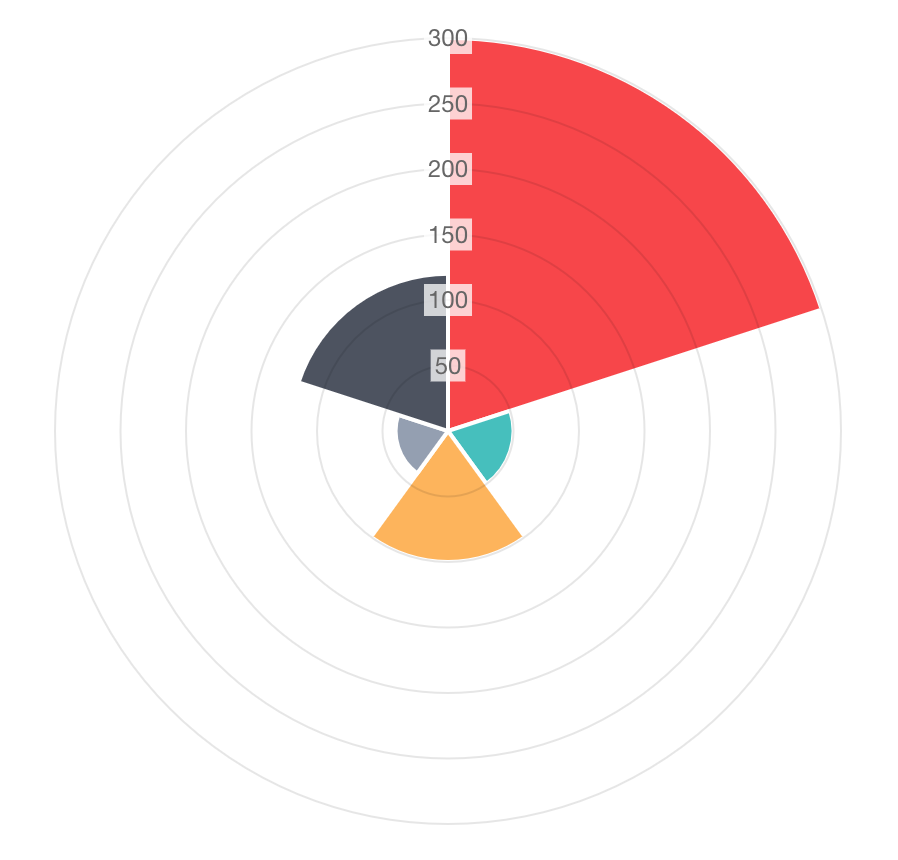
Chart.js
- Free, open source
- 6 chart types: line, bar, radar, polar, pie/doughnut
- Based on
canvas
NVD3.js
- Free, open source
- It uses D3.js
- Based on
SVG
NVD3.js
HighCharts
- Free for non-commercial use, open source
- Gazillions of chart types
- Highmaps and highstock
- Based on
SVG
HighCharts
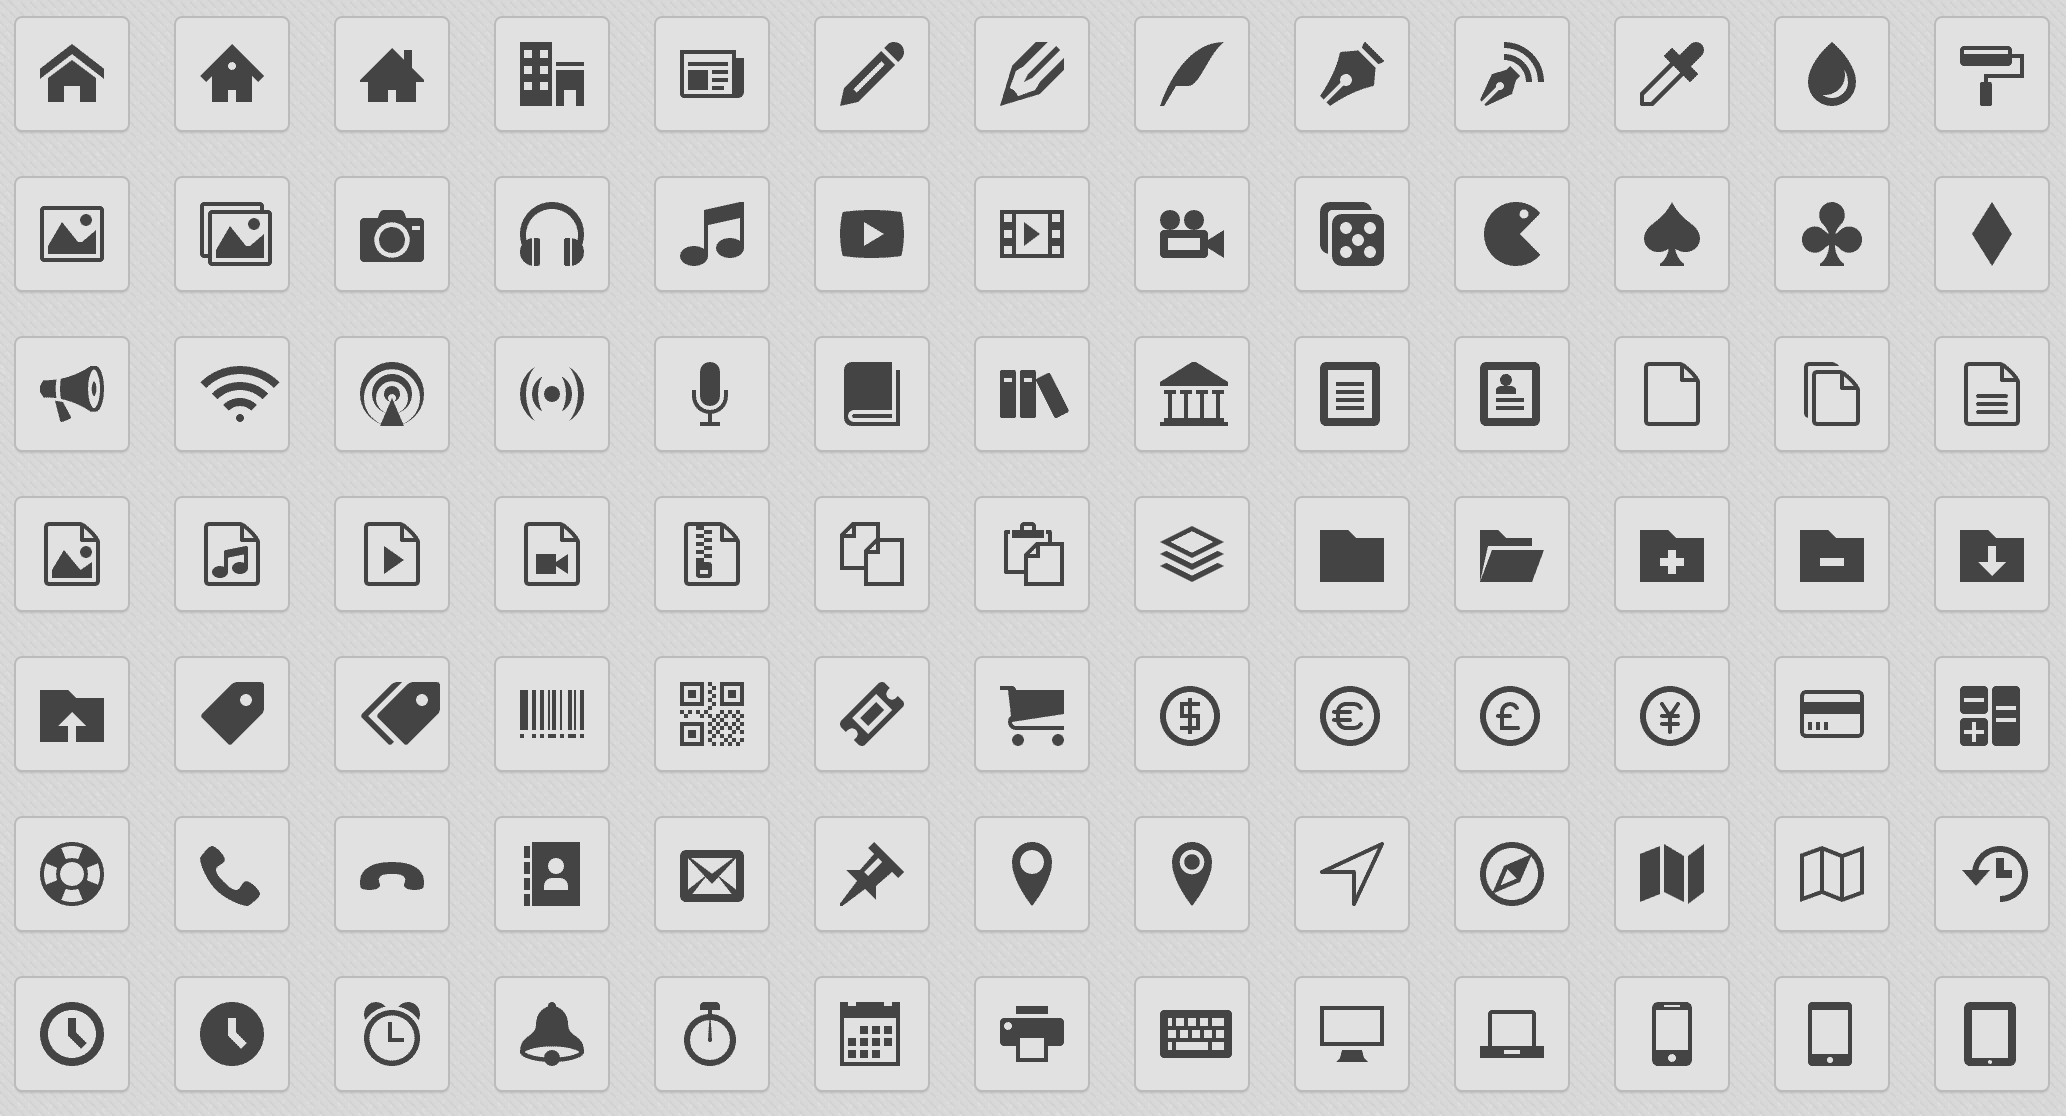
Icons
I them!
When to use
- Input forms:
- Enumerations:
- External links:
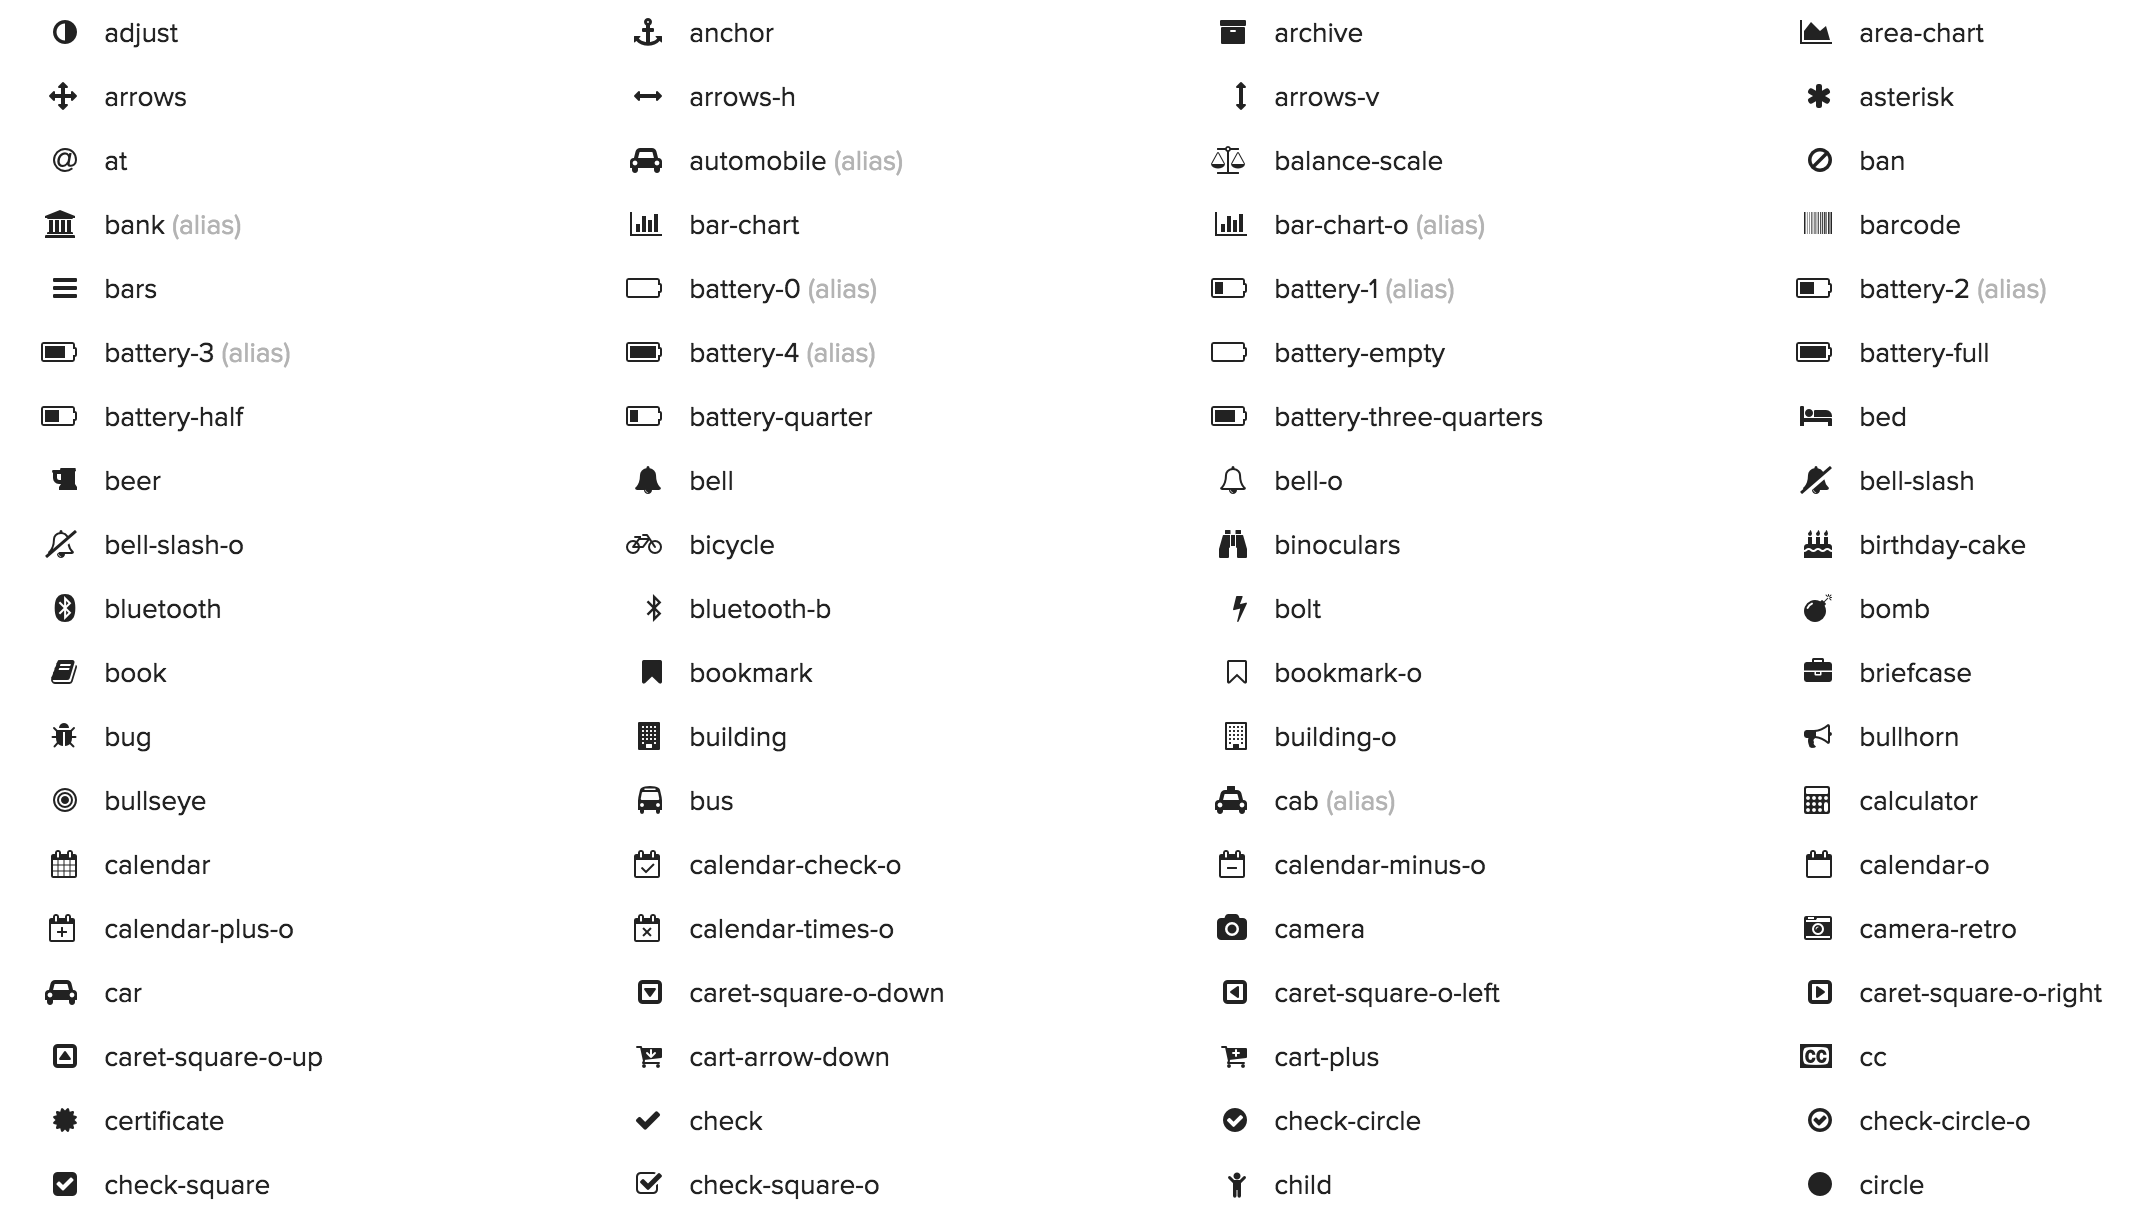
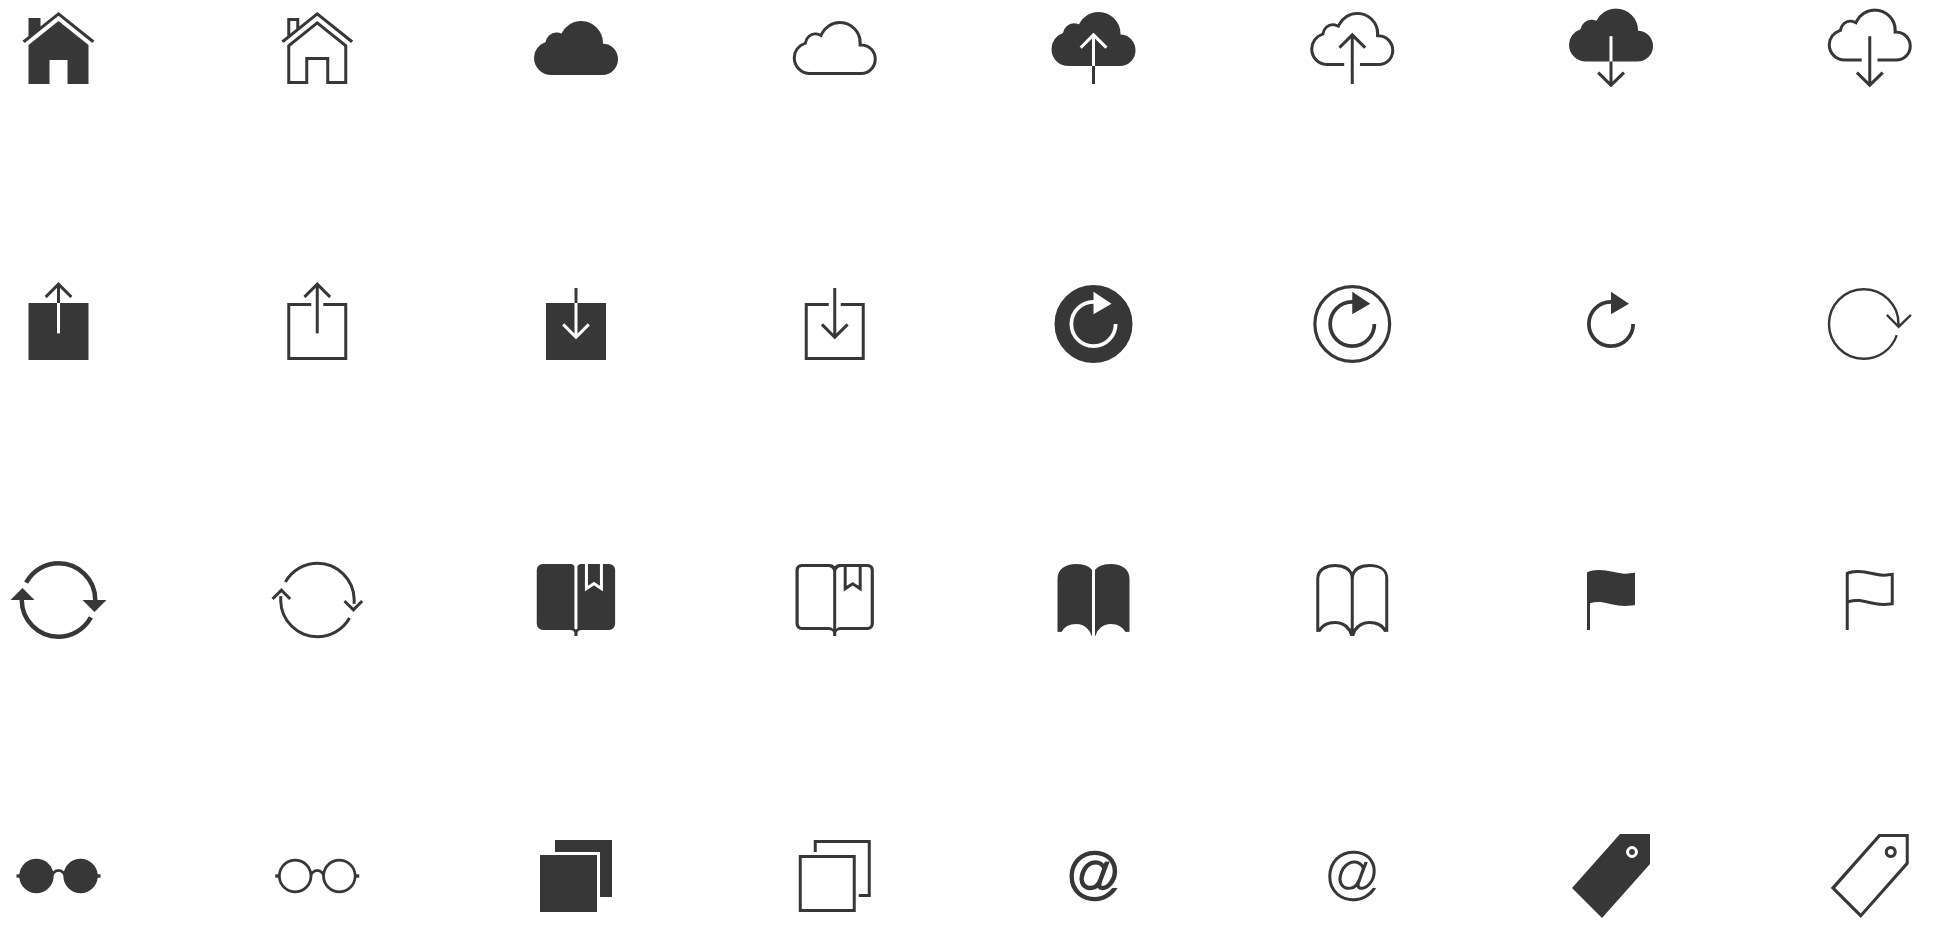
Scalable vector icons
- Easy to change color:
- Change size without quality loss:
- Font pack: one HTML call to fetch them all
Font Awesome
IcoMoon
ionicons
Font Awesome
Font Awesome + animate.css
//CSS
.custom-car {
  animation: slideOutLeft 1s infinite alternate;
}
.custom-ball {
  animation: bounce 1s infinite;
  display: inline-block;
}
.custom-ball i {
  animation: rubberBand 1s 0.2s infinite ease-out;
}
Custom views
When to use
- Plot libraries don't satisfy us
- We have a new way to display data
- Nobody else write something similar to our idea
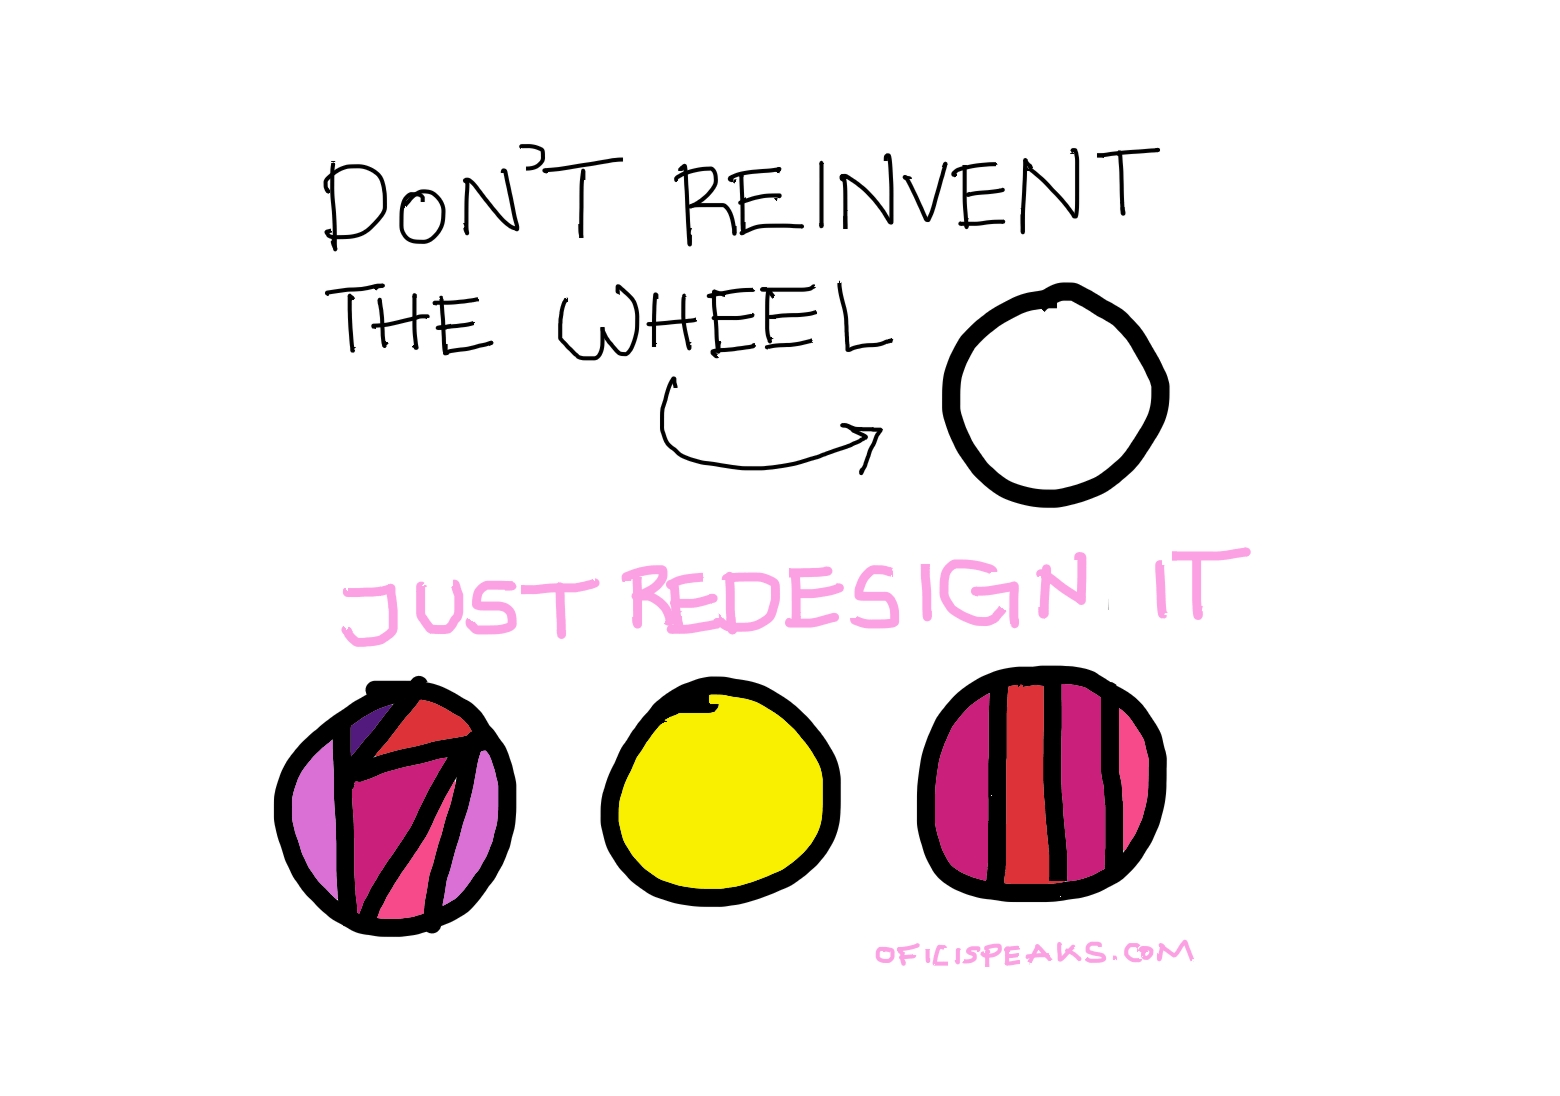
- We really want to reinvent the wheel
D3.js
- Binds our data to page DOM
- Uses web standards (HTML, SVG, CSS), no proprietary framework
- Data driven approach
Pure Javascript Vs D3.js
var paragraphs = document.getElementsByTagName("p");
for (var i = 0; i < paragraphs.length; i++) {
  var paragraph = paragraphs.item(i);
  paragraph.style.setProperty("width", data[i]) + "px";
}
d3.selectAll("p")
.data(data)
.style("witdh", function(d) { return d + "px"; });Steps
- Select
element frameyou work on it - Select
elementsinside yourframe - Bind data on selected elements
- Style them based on linked data (use scale)
- Define
enter/exitmethods
1.Select element frame
var myData = [10, 25, 40];

d3
  .select('#d3-frame')
2.Select elements
var myData = [10, 25, 40];

d3
  .select('#d3-frame')
  .selectAll('i')
3.Bind data
var myData = [10, 25, 40];

d3
  .select('#d3-frame')
  .selectAll('i')
  .data(myData)
4.Style them
var myData = [10, 25, 40];

d3
  .select('#d3-frame')
  .selectAll('i')
  .data(myData)
  .style('font-size', function(d) {return d + 'px';})
4b.Style them with scales
var myData = [10, 25, 40];

var colorScale = d3.scale.linear()
        .domain([d3.min(myData), d3.max(myData)])
        .rangeRound([0, 255]);

d3
  .select('#d3-frame')
  .selectAll('i')
  .data(myData)
  .style('font-size', function(d) {return d + 'px';})
  .style('color', function(d) {
    return 'rgb(0, ' + colorScale(d) + ', 0)';
  });
5. Define enter / exit methods
var myData = [10, 25, 40, 5, 50, 20, 16, 18, 60, 55, 20];
var colorScale = d3.scale.linear()
  .domain([d3.min(myData), d3.max(myData)])
  .rangeRound([0, 255]);

var stars = d3
  .select('#d3-frame')
  .selectAll('i')
  .data(myData);

stars.enter()
  .append('i')
  .attr('class', 'fa fa-star');

stars.exit()
   .remove();

stars
  .style('font-size', function(d) {return d + 'px';})
  .style('color', function(d) {
    return 'rgb(0, ' + colorScale(d) + ', 0)';
  });
Now you can do this!
Alan Walker - FadeAudience check

The journey continues

D3 Transitions!
w/o transitions
(Click on the ball to change the linked data)- Very ugly when data changes
- Previous and new data seem unrelated
- It doesn't respect reality
w/o transitions
.ball-canvas { position: relative; }
.ball-canvas i { position: relative; }
var myData = [getRandomInt(-400, 400)];
d3
.select('#trans-id')
.selectAll('i')
.data(myData)
.style('left', function(d) { return d + 'px'; });With transitions!
var myData = [getRandomInt(-400, 400)];

d3
  .select('#trans-id')
  .selectAll('i')
  .data(myData)
  .transition()
  .style('left', function(d) { return d + 'px'; });
With transitions, duration and easing!
var myData = [getRandomInt(-400, 400)];

d3
  .select('#trans-id')
  .selectAll('i')
  .data(myData)
  .transition()
  .style('left', function(d) { return d + 'px'; })
  .duration(1300)
  .ease('elastic');
Tween interpolation
var myData = [getRandomInt(-400, 400)];

d3
  .select('#trans-id')
  .selectAll('i')
  .data(myData)
  .transition()
  .styleTween('transform', function(d, i, a) {
    var prevTransProp = (d3.select(this).attr('style') || ':').split(':')[1];
    return d3.interpolateString(prevTransProp, ' translateX('+ d + 'px) rotateZ(' + d * 2 + 'deg)');
  })
  .duration(1300)
  .ease('bounce');
... Not only <div>
- We can draw in
<canvas> - And we can edit
<svg>HTML tag too!
<svg>
var width = 150;
var height = 150;
var maxValue = 100;

d3
  .select('#svg-id-1')
  .on('click', refreshData);

var pi = Math.PI;

var arc = d3.svg.arc()
      .innerRadius(50)
      .outerRadius(70)
      .startAngle(0 * (pi/180)) //converting from degs to radians
      .endAngle(function(d){return (d.value / maxValue) * 2 * pi;}) //just radians

var svg = d3.select("#svg-id-1").select("svg")
  .attr("width", width)
  .attr("height", height);

var field = svg.selectAll(".field")
  .data([{value: getRandomInt(-maxValue, maxValue)}])
  .attr("transform", "translate(75,75)");

var path = field
  .select('path')
  .attr("class", "path path--background");

var label = field.select("text")
  .attr("class", "label")
  .attr("dy", ".35em");

refreshData();

function refreshData() {
  var myData = getRandomInt(-maxValue, maxValue);

  path
    .each(function(d) { d.previous = d.value, d.value = myData; })
    .transition()
    .ease("elastic")
    .duration(750)
    .attrTween("d", arcTween);

  label.text(function (d) {return d.value;})
}

function arcTween(b) {
  var i = d3.interpolate({value: b.previous}, b);
  return function(t) {
    return arc(i(t));
  };
}
<canvas>
var width = 865;
var height = 150;
var minValue = 10;
var maxValue = 60;

d3
  .select('#canvas-id-1')
  .on('click', refreshData);

var canvas = d3.select("#canvas-id-1").select("canvas")
  .attr("width", width)
  .attr("height", height);

var context = canvas.node().getContext('2d');
var dataContainer = d3.select(document.createElement("data-container"));

var scalePosX = d3.scale.linear()
  .domain([minValue, maxValue]).rangeRound([maxValue / 2, width - maxValue / 2]);
var scalePosY = d3.scale.linear()
  .domain([minValue, maxValue]).rangeRound([maxValue / 2, height - maxValue / 2]);

refreshData();
drawCanvas();
function refreshData() {

  var myData = [{x: getRandomInt(minValue, maxValue), y: getRandomInt(minValue, maxValue)}];
  var dataBinding = dataContainer.selectAll('custom-circle').data(myData)
  dataBinding.enter()
    .append('custom-circle')
    .attr('x', width / 2)
    .attr('y', height / 2)

  dataBinding
    .transition()
    .ease("elastic")
    .duration(2000)
    .attr('x', function(d) { return scalePosX(d.x); })
    .attr('y', function(d) { return scalePosY(d.y); })
    .attr("radius", function(d) {return d.x;})
    .attr("fillStyle", function(d) {return 'hsl(' + d.x * 10 +', 100%, 60%)'});
}

function drawCanvas() {
  requestAnimationFrame(drawCanvas);
  // clear canvas
  context.fillStyle = "#fff";
  context.rect(0,0,canvas.attr("width"),canvas.attr("height"));
  context.fill();

  var elements = dataContainer.selectAll("custom-circle");
  elements.each(function(d) {
    var node = d3.select(this);

    context.beginPath();
    context.fillStyle = node.attr("fillStyle");
    context.arc(node.attr("x"), node.attr("y"), node.attr("radius"), 0, 2 * Math.PI);
    context.fill();
    context.closePath();

  });
}